Organizing Google Ads PPC Reports
Your Google Ads account shows tons of important metrics for you to optimize your campaigns and garner more return on your investment. But all that info coming at you at once can be overwhelming.
Between your targeted keyword volumes and your differing timelines, it’s all too easy to get lost in the forest of data on your Google Ads reports. Fortunately, the PPC team at VisualFizz has a few simple tips to help you organize your Google Ads data for effective reporting and analysis.
Why Organize PPC Data on a Google Ads Dashboard in the first place?
According to Marissa Ryan, Co-Founder of VisualFizz,
Effective PPC campaigns only happen when marketers can measure the success of a campaign and optimize accordingly — and that means they need to know what to track.
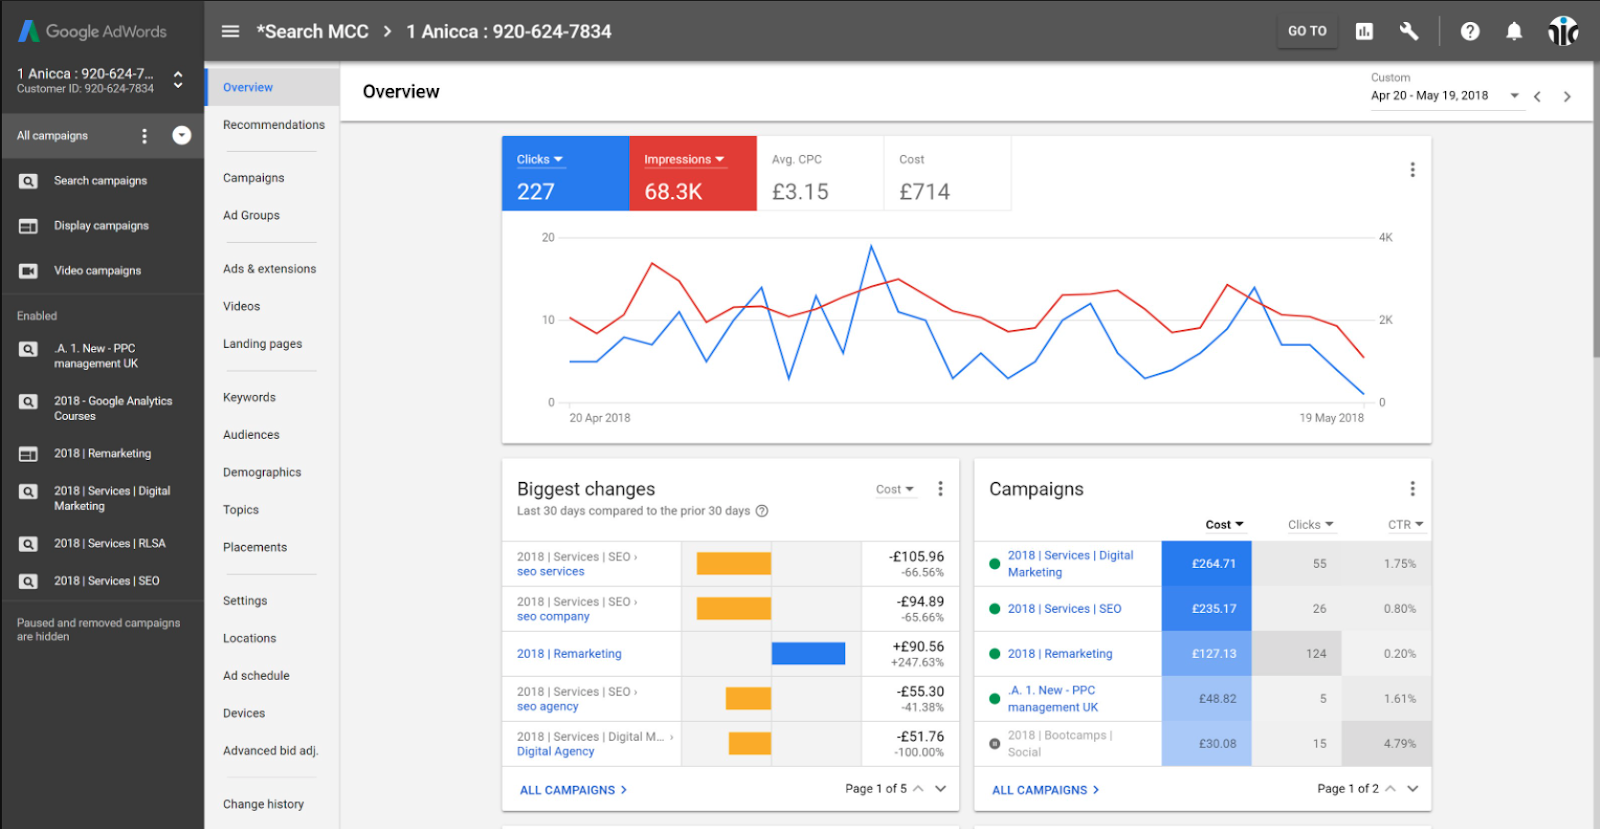
That’s why the Google Ads Dashboard is so effective, it places all the data you need at your fingertips. But that doesn’t mean the data is organized in a way that enables you to take action. If you’re an eCommerce brand, for example, you could have mountains of data before you, and not know if you are tracking the 5 Essential PPC KPIs for eCommerce Brands to Track.
Google Ads Dashboard Tip #1: Show Your Bottom-Line Metrics
There are tons of metrics available inside your Google Ads performance report. Yet Databox found that more than half of marketers include just three to five metrics on their own Google Ads dashboard.
Why? Because viewing your most important metrics without the fluff helps you understand the actual impact of your campaigns—especially if those metrics impact your bottom line. Grant Higginson of Welby Consulting explains:
“It’s critically important that any Google Ads Dashboard include conversion data such as number of conversions, cost per conversion, conversion value, Return On Advertising Spend (ROAS)...By keeping your dashboard conversion and business-goal focused you’ll be able to make better decisions in the long-term.”
Metrics that count as “bottom-line” will likely always include metrics related to money: the spend on a particular campaign or channel, the return on an investment, the cost per acquisition – money. Tracking dollars and cents can be significantly more telling than tracking click-through rates alone, and positioning marketing data in terms your executive team can understand – money – can get you further in a meeting room than other metrics related to engagement can.
Google Ads Dashboard Tip #2: Filter by Campaign
From sales to website traffic, you can run Google Ads campaigns with any metric as your goal. But running campaigns with different messaging calls for campaign-level reporting, doesn’t it? Tabitha Young of 30 Degrees North explains:
“It isn’t helpful to know that your overall CTR is 7.5% if you have one campaign that is struggling to get a 1% CTR… I typically like to break out each campaign by Impressions, Clicks, CTR, Avg CPC, conversions, and cost. This helps our clients really understand how each campaign is truly performing.”
Google Ads Dashboard Tip #3: Run Comparisons and AB Tests
No one will argue the value of campaign performance data. But knowing that your campaigns are doing well, and understanding how, when and why they are doing well are two different things.
With Google Ads, you can dive as deep into your analytics to perform AB tests and compare results month-by-month; year-by-year, and before and after an event, like hiring a new team member.
With this type of data in your dashboard, you can see if your new marketing team member has the Soft Skills to Help You Succeed in Digital Marketing, or needs more work.
“Regardless of how you slice your data,” Greg Trahan of Digital Ads Optimism says that “this comparison will help you to quickly identify changes in performance. It also makes it easier to monitor the impacts of strategic changes.”
Let’s say, for example, that you write two different content pieces to your blog – one written in style A and one written in style B. You could run an AB test to see which one is best optimized for Google’s latest BERT algorithm update, and post the one that performs best.
Make Your Google Ads Data Work Harder for You
As you can see, there are more ways to slice your data than the report may indicate inside your Google Ads account.
Try creating these three views on your custom dashboards. Not only will it help you understand the bottom-line value of your Google Ads campaigns (both individually and as a whole), but you’ll see a trend of how your results change over time.
However, just as we said at the start of this article, having data, and understanding it enough to take action are entirely different things. VisualFizz is a full service online marketing agency with the expertise and know-how to turn your valuable data into actionable results.
From high-quality SEO, to branding and social media, we bring stability to the ad-hoc processes that inhibit growth and return on your marketing investments.
Contact us today to get started.
Publishing Date: